Reading ECG Strips
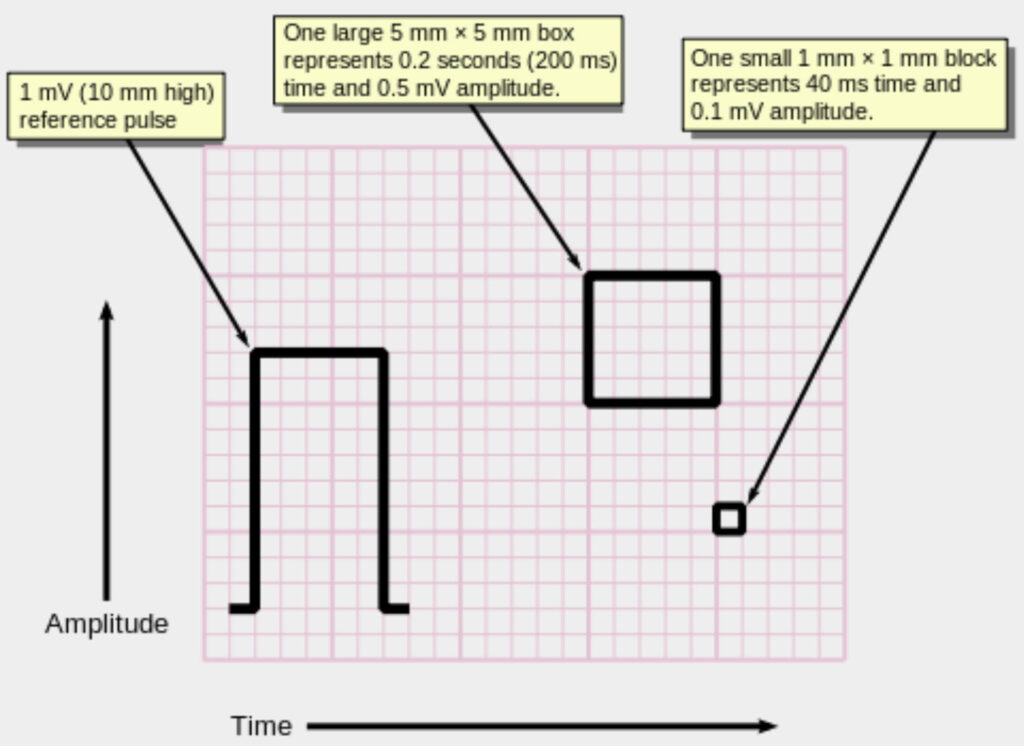
Ok, so the ECG machine captures the electrical stimulus of the heart and represents it as a pattern of waves printed on graph paper. The graph represents the amplitude of electrical activity over time (see image).
All the details you’ve just read can be really difficult to remember and most likely a little confusing. So where do you start once you need to work on the normal and possibly not so normal wave forms on a little strip of paper?
When you start to interpret an ECG waveform it’s best to be systematic. First trick of course, is to always check that you have the correct up to date ECG of the client.
History RRAWS
A helpful mnemonic History RRAWS can help you what to look for and in which order.
History – get the client’s history
R – Rate
R – Rhythm
A – Axis
W – Waveform (the various waveforms)
S – Segments (intervals)
Interpreting a ECG waveform
Step 1: Determine the heart rate
6-Second Method: Obtain a 6 second strip, count the QRS complexes and multiple by 10—i.e. 8 QRS complexes
Complexes x 10 = rate of 80 heart beats/per/minute
OR
Count 30 large boxes, starting from the first R wave (R wave to the next R wave is known as an RR interval).
Multiply 8 x 10 = Rate 80.
Step 2: Determine the heart Rhythm
Find the RR intervals again and check if they are equally spaced. If they are equally spaced then the rhythm is regular. If not, it is irregular.
By measuring the interval between R to R waves for ventricular rhythms and the interval between the P to P waves for atrial rhythms.
Step 3: Determine the Axis
You can only determine the axis in a 12 Lead ECG. Just remember to get into the habit of recalling RRAWS and working through your ECG systematically!
Tip!
Did you know that the “lub-dub” of a heartbeat is the sound made by the four valves of the heart closing?
Step 4: Determine the Waveforms
5 questions to ask yourself when analysing P waves:
- Are P Waves present?
- Are P Waves occurring regularly?
- Is there a P Wave for each QRS?
- Are the P Waves smooth, rounded, and upright in appearance, or are they inverted?
- Do all P Waves look similar?
QRS Complex
3 questions to ask yourself when analysing QRS complex
- Are QRS intervals greater than 0.12 second (wide)? If so, the complex may be ventricular in origin.
- Are QRS intervals less than 0.12 seconds (narrow)? If so, the complex is most likely supraventricular in origin.
- Are QRS complexes similar in appearance across the ECG strip?
1 question to ask yourself when analysing the QRS complex:
1. What is the width of the QRS complex? It should be approximately 0.12 seconds (3 small squares).
Tip!
If the QRS complex is longer than 0.12 seconds, it suggests the complex originated in the ventricles. If it is shorter than 0.12 seconds, it suggests the complex is supraventricular in origin.
T Waves
4 questions to ask yourself when analysing T waves:
- Are the T waves spread out or narrow?
- Are the T waves quite tall?
- Are the T waves inverted?
- Are there inverted T waves in more leads other than V and V (in a 12 lead ECG)?
Step 5: Determine the Segments
PR interval – normal length of the PR interval is 0.12 to 0.20 seconds (3 to 5 small squares).
3 questions to ask yourself when analysing the PR interval:
- Are PR greater than 0.20 seconds?
- Are PR less than 0.12 seconds?
- Are the PR interval’s constant across the ECG strip?
What is the significance of the ST segment?
The ST segment represents the interval between ventricular depolarisation and repolaristaion. The most common cause of ST segment abnormality (elevation or depression) is myocardial ischemia/infarction!
2 questions to ask yourself when analysing the ST segment:
- Are the ST segments level with the PR interval?
- Are ST segments level with the TP segments?
Tip!
ST elevation is significant when it is greater than 1mm (1 small square) in 2 or more limb leads or >2mm in 2 or more chest leads.

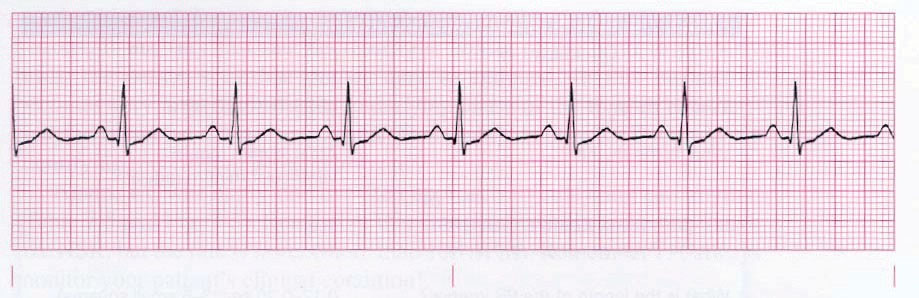
Looking at the simple rhythm strip above again, can you determine the rate, rhythm, P waves, the PR interval and the QRS complex? Even a short strip can provide you with sufficient information to determine what sort of heart rhythm it is. The axis cannot be determined as it apparent in a 12 Lead ECG.
Remember History RRAWS
History – was not provided for this example!
Rate – 80 bpm
Rhythm – regular
Axis – cannot be determined from a strip
Wave – P wave present
Segment – PR interval 0.12 seconds (3 small squares) and QRS complex 0.08 seconds (2 small squares).
Diagnosis: Normal sinus rhythm
Is it a shockable rhythm? – No. Please don’t!
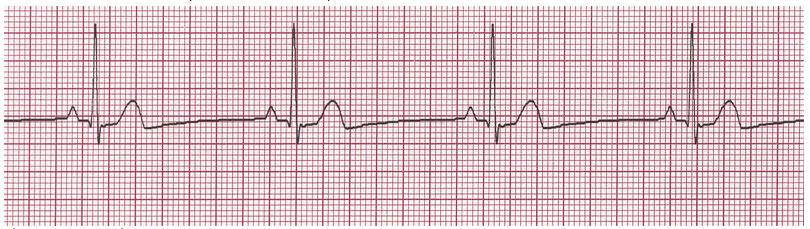
What does this rhythm strip tell you?
Resources
Here are some great resources for you to look and practice reading rhythm strips.
Check out the Arrhythmia Guide and an ECG Practice Drill!
Tip!
Atrium is Latin for “entrance hall,” and ventricle is Latin for “little belly.”